

Release Updates - 3.116
Broker-level Dashboard Charts
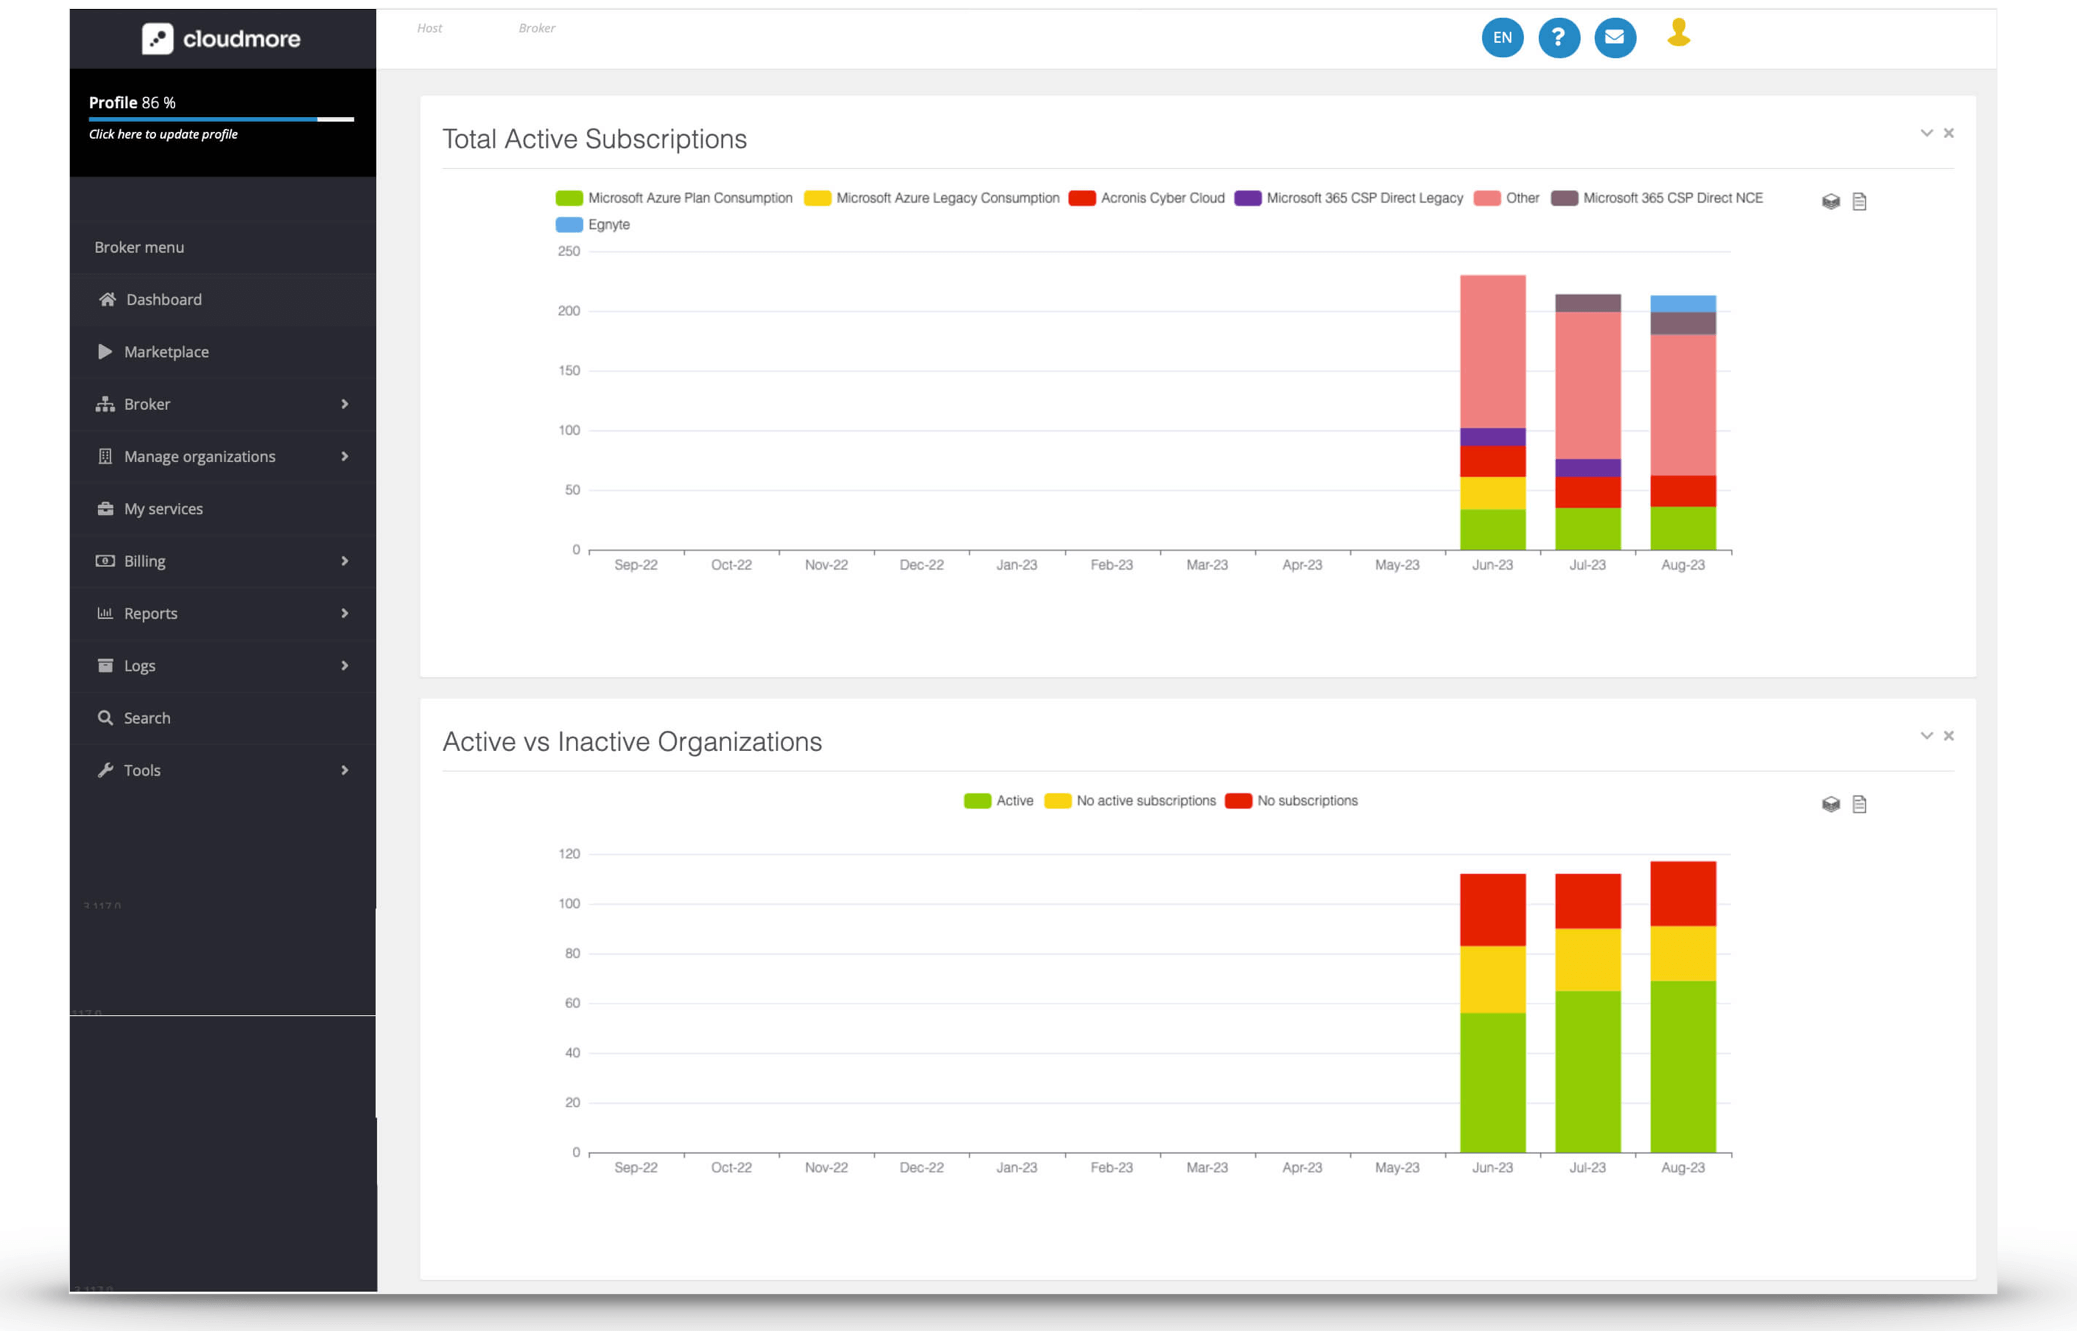
Easily access insights right from your Cloudmore dashboard. Dive into details about active and created subscriptions, as well as active and inactive organisations. Simply select Dashboard from the Cloudmore menu to get started.
Highlighted Features
- Data Timeline: Data collection commenced from June 2023. Please note that data prior to this date isn't available.
- Customizable Graph Views: Toggle between bar and stack chart visualizations.
- Accessible Underlying Data: Get a closer look at the raw data anytime.
- Interactive Insights: Hover over any chart segment to reveal specific data details for that section.
Whats next?
We value your insights! As we strive to enhance the Broker-level charts, your feedback is instrumental. Please compile your thoughts on features or data that would be beneficial, along with the reasons why. Bring these insights to your next Customer Success meeting.
Maximizing Chart Value
A simple yet impactful way to utilize these charts is by including them in your monthly reports. Capturing screenshots can effectively illustrate the trajectory of service and customer activities within Cloudmore.
Share this
Platform Update | September 2023
Platform Update | September 2023
September 14, 2023
1
min read
Platform Update | November 2023
Platform Update | November 2023
November 15, 2023
2
min read
Platform Updates | August 2023
Platform Updates | August 2023
August 24, 2023
2
min read